CAT2001 Related Question Answers
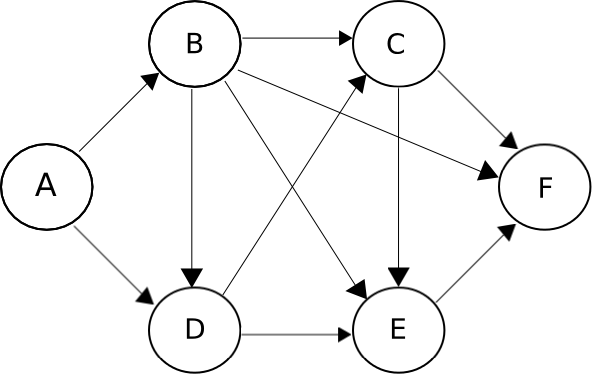
51. The figure below shows the network connecting cities A, B, C, D, E and F. The arrows indicate permissible direction of travel. What is the number of distinct paths from A to F?
52. Let n be the number of different five-digit numbers, divisible by 4 with the digits 1, 2, 3, 4, 5 and 6, no digit being repeated in the numbers. What is the value of n?
53.
Directions for the following four questions: Answer the questions based on the table given below.The following table describes garments manufactured based upon the color and size for each lay. There are four sizes: M – medium, L – large, XL – extra large and XXL – extra extra large. There are three colors: yellow, red and white. How many lays are used to produce yellow fabrics?
57.
Directions for the following four questions: Answer the questions based on the table given below concerning the busiest 20 international airports in the world. How many international airports of type ‘A’ account for more than 40 million passengers?
59. Of the five busiest airports, roughly, what percentage of passengers in handled by Heathrow Airport?
61.
Directions for the following five questions: Answer the questions based on the two graphs shown below.Figure I (the chart on the left) shows the amount of work distribution, in man-hours, for a software company between offshore and onsite activities.Figure 2 (the chart on the right) shows the estimated and actual work effort involved in the different offshore activities in the same company during the same period.[Note: Onsite refers to work performed at the customer’s premise and offshore refers to work performed at the developer’s premise.] Which work requires as many man-hours as that spent in coding?
64. If the total working hours were 100, which of the following tasks will account for approximately 50 hr?
65. If 50% of the offshore work were to be carried out onsite, with the distribution of effort between the tasks remaining the same, the proportion of testing carried out offshore would be
66. If 50% of the offshore work were to be carried out onsite, with the distribution of effort between the tasks remaining the same, which of the following is true of all work carried out onsite?
67.
Directions for the following three questions: Answer the questions based on the pipeline diagram below.The following sketch shows the pipelines carrying material from one location to another. Each location has a demand for material. The demand at Vaishali is 400, at Jyotishmati is 400, at Panchal is 700, and at Vidisha is 200. Each arrow indicates the direction of material flow through the pipeline. The flow from Vaishali to Jyotishmati is 300. The quantity of material flow is such that the demands at all these locations are exactly met. The capacity of each pipeline is 1,000.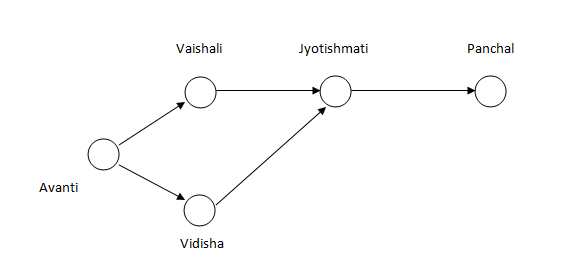 The quantity moved from Avanti to Vidisha is
70.
Directions for the following three questions: Answer these questions based on the data given below:There are six companies, 1 through 6. All of these companies use six operations, A through F. Thefollowing graph shows the distribution of efforts put in by each company in these six operations.The Y axis represents the % distribution of effort and the X axis represents the company Suppose effort allocation is inter-changed between operations B and C, then C and D, and then D and E. If companies are then ranked in ascending order of effort in E, what will be the rank of company 3?
71. A new technology is introduced in company 4 such that the total effort for operations B through F get evenly distributed among these. What is the change in the percentage of effort in operation E?
72. Suppose the companies find that they can remove operations B, C and D and redistribute the effort released equally among the remaining operations. Then which operation will show the maximum share across all companies and all operations?
73.
Directions for the following three questions: Answer the questions based on the pie charts given below.Chart 1 shows the distribution of 12 million tonnes of crude oil transported through different modes over a specific period of time.Chart 2 shows the distribution of the cost of transporting this crude oil. The total cost was Rs. 30 million.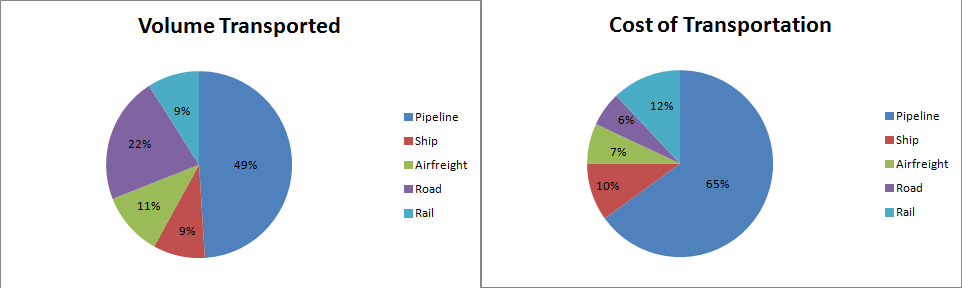 The cost in rupees per tonne of oil moved by rail and road happens to be roughly
75. If the costs per tonne of transport by ship, air and road are represented by P, Q and R respectively, which of the following is true?
 Powered By:Omega Web Solutions
© 2002-2017 Omega Education PVT LTD...Privacy | Terms And Conditions